FOUR AREAS OF OPPORTUNITY WHEN USING STATISTICAL GRAPHS Stacked bar charts. Choose the correct axis scale and data origin. Pie charts. Avoid them for describing phenomena with more than two variables. Scope charts. Make sure to clearly label the graphed data. Choropleth maps. Establish a scale of contrasting colors to avoid confusion. Source: ​Staff, 2026, Acertiva​

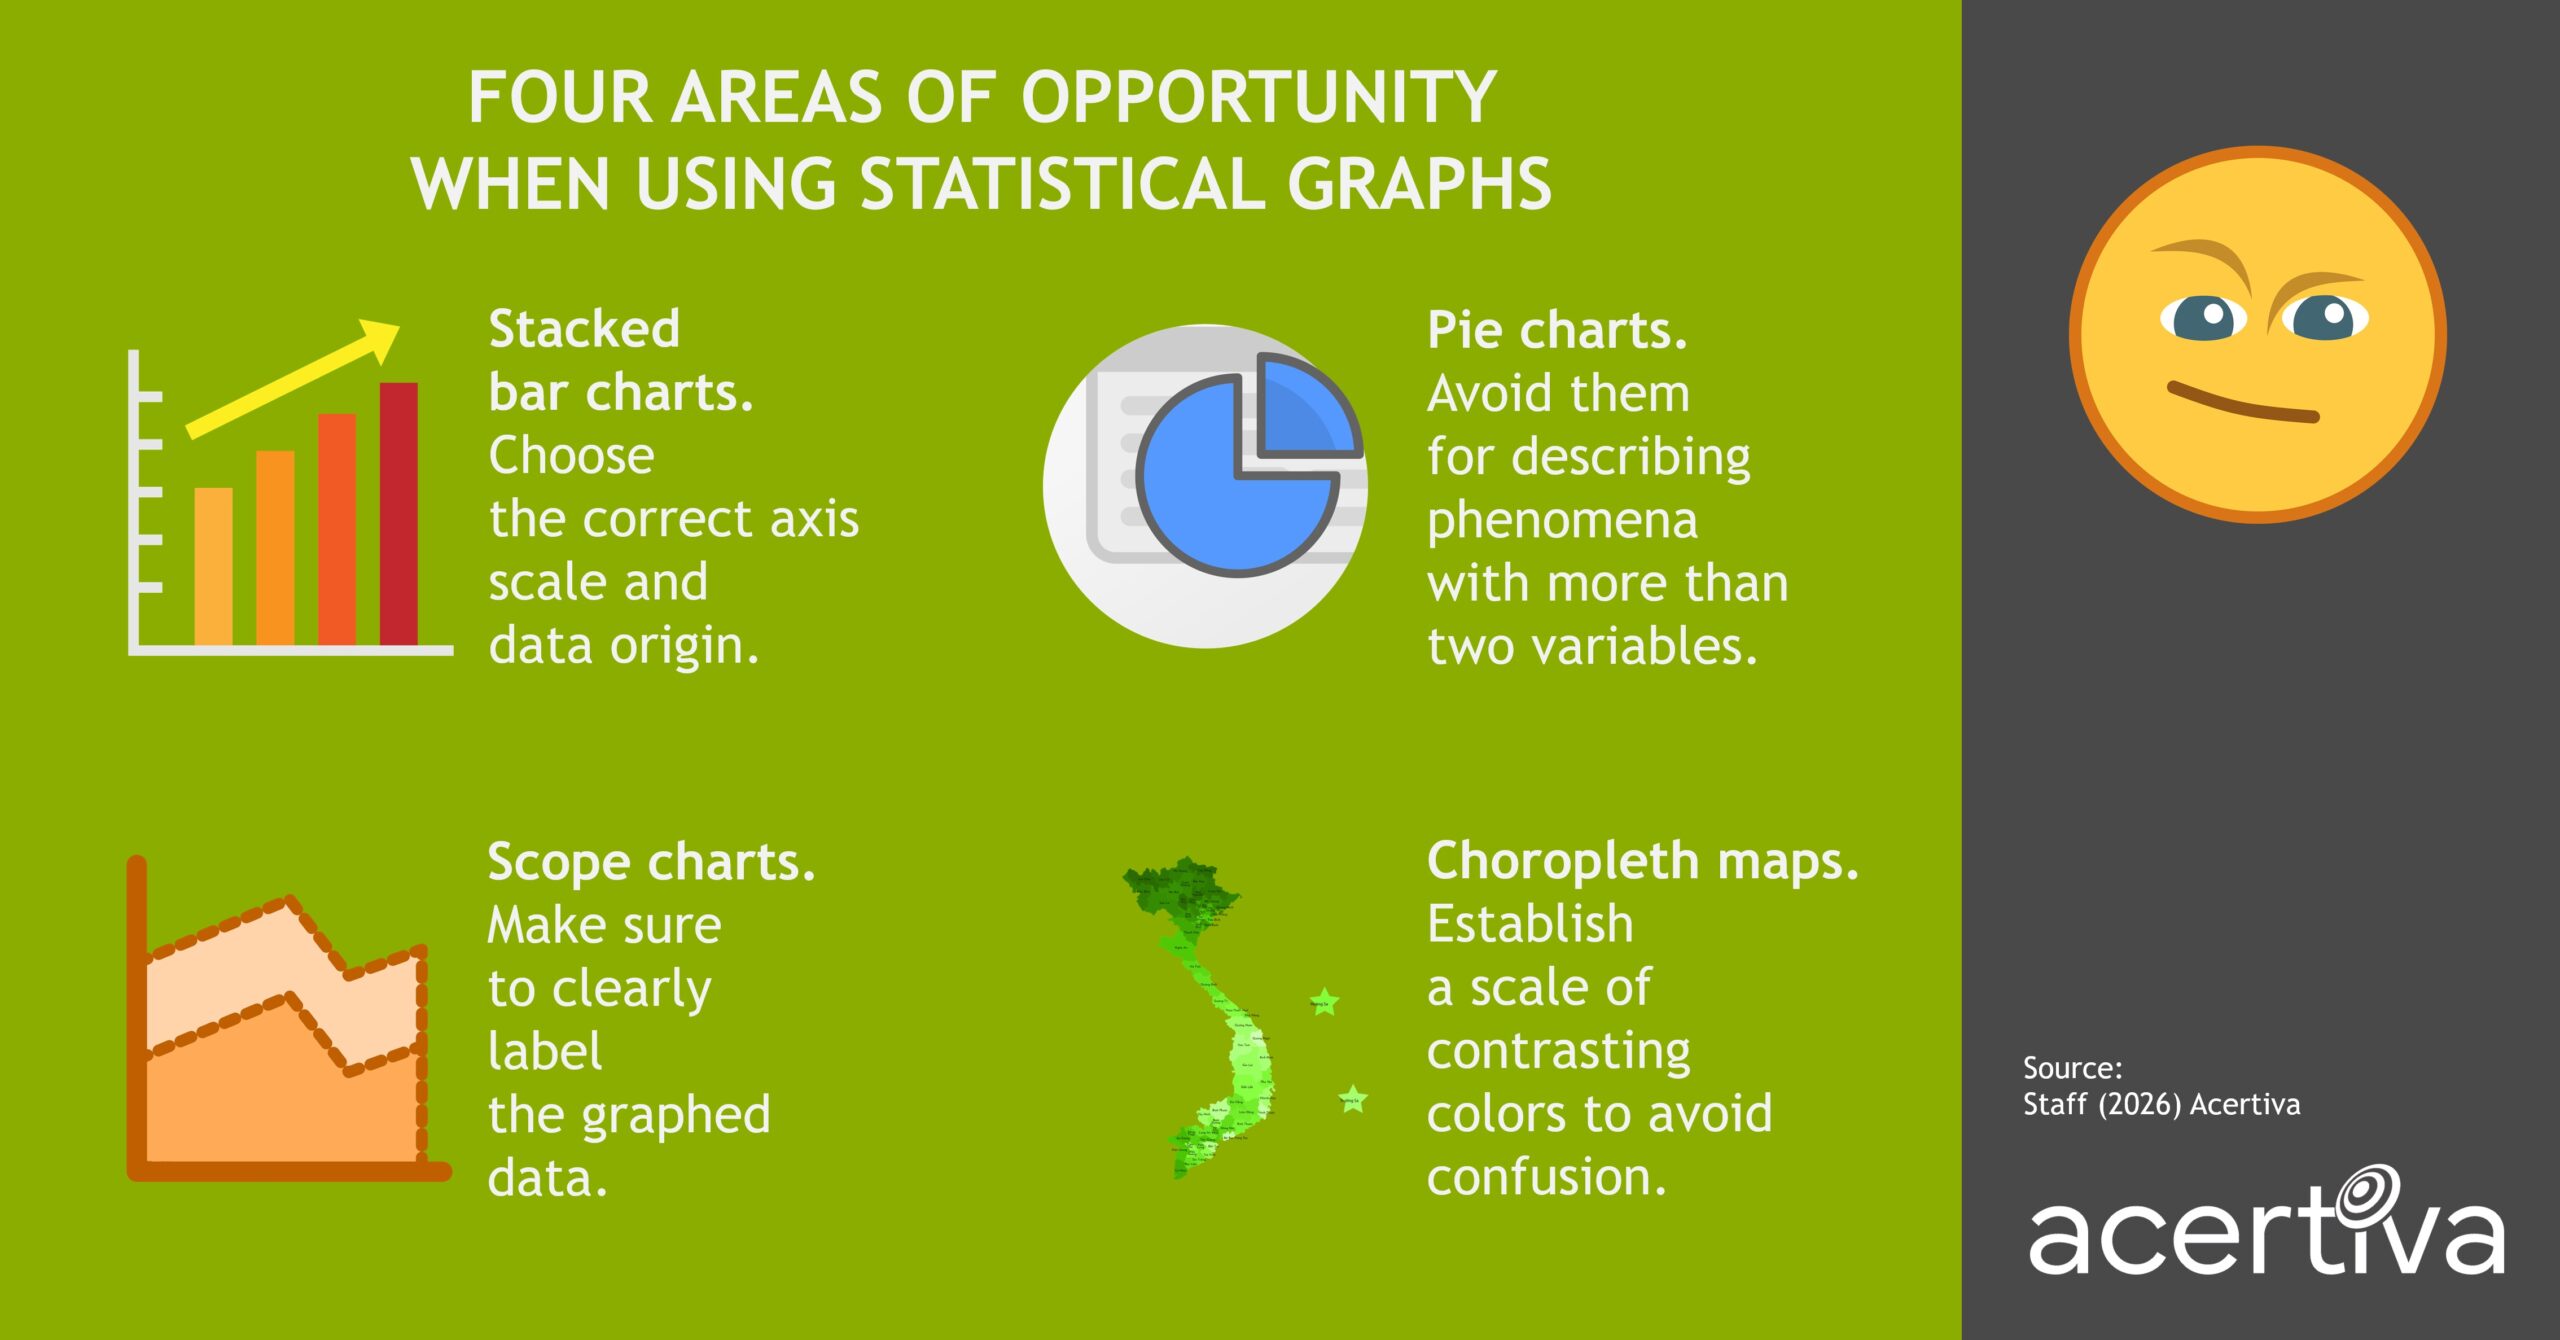
Four Areas Of Opportunity When Using Statistical Graphs

FOUR AREAS OF OPPORTUNITY WHEN USING STATISTICAL GRAPHS Stacked bar charts. Choose the correct axis scale and data origin. Pie charts. Avoid them for describing phenomena with more than two variables. Scope charts. Make sure to clearly label the graphed data. Choropleth maps. Establish a scale of contrasting colors to avoid confusion. Source: ​Staff, 2026, Acertiva​


Posted

in

by

Tags: